
Ai
 Share on:
Your agent is repeating itself
In 2025, I did a series of videos that went through five design principles for production-ready AI agents. In my episode about guardrails, I made the statement, “If you can get away with not calling a model, do that.” In the episode about agent tools, I made an argument saying to build idempotent tools and store responses temporarily in case of retries or duplicate requests. I didn’t know it at the time, but I essentially was making the same argument just with different words.
What I was talking about was caching. Caching in agentic development is not only the easiest way to decrease Time to First Token (TTFT), but also a significant money saver as well. When you return a response without running inference, your applications appear snappier and also avoid LLM usage costs.
But caching isn’t as easy with agents as it is when you’re throwing it in front of your database. Agents generally have two types of caching: exact-match KV caching and semantic caching. The sole purpose of these tiers is to avoid unnecessary and expensive compute costs.
For many large-scale agent applications, exact-match and semantic caching solve different kinds of repetition. Luckily, it’s easier to implement than you might think with the right tooling.
But before we get into the details, we need to learn a bit more about why this is such a big problem.
Before I continue, thank you to BetterDB for sponsoring this post. All opinions are my own.
Repetition costs you money
If you spend a few minutes scrolling through a agent logs, you’ll see the same thing over and over.
The agent retries a tool call when the response is slow. It re-fetches metadata because it’s too deep in the context window. It picks a tool, runs arguments it ran ten minutes earlier, and carries on like nothing happened. Users add to this by asking variations of the same question back to back trying to refine what they want to happen.
This rework on top of more rework costs tokens. A large chunk of production agent traffic isn’t unique tokens at all. It’s the same tokens over and over again.
Uncaught retries hit the model with tool response bloat. Every paraphrased question runs another retrieval pipeline. Polling loops can trigger retrieval and embedding work that isn’t needed.
How much running an agent in production costs is mostly driven by how much you let through. All too often we’re focused on the model bill, but the lever that drives the most cost sits one layer up: in the code.
Two types of repetition
Repetition is repetition is repetition, right? As we just learned, there are two types of repetition we cache. Kristiyan Ivanov, CTO and founder of BetterDB, does a good job explaining them:
One is machine-generated repetition: agents retrying tool calls with identical arguments, polling loops, copy-pasted questions. The other is human paraphrase: the same intent expressed in different words. “What is Valkey?” vs “Tell me about Valkey.”
Machine repetition is exact. The arguments match byte for byte, so the right move is to hash the request and look up the answer in sub-millisecond time. SET, GET. No embeddings or model call. If you’ve done some type of agent caching before, it’s probably this one.
Human paraphrase isn’t exact. “What’s Valkey?” and “Tell me about Valkey” mean the same thing semantically, but a string-match cache will miss every time. To catch this one, you embed the question in a vector store and look for vectors that are similar to it. The embedding adds about 100ms the first time you see a new question, and you pay it once to serve every paraphrase of it from there.
flowchart TD
    Q[Incoming request] --> T1{Exact-match KV}
    T1 -->|Hit: machine repetition| R1([Return cached])
    T1 -->|Miss| T2{Semantic cache}
    T2 -->|Hit: human paraphrase| R2([Return cached])
    T2 -->|Miss| T3[RAG pipeline]
    T3 --> R3([Fresh answer])
In an efficient production system, exact-match comes in front of semantic caching, and semantic caching is in front of the model. If you don’t run an exact-match in front of a semantic cache, you end up paying for an embedding lookup on every machine retry 🫠.
Making your agent cache ready
If you’re running your app at scale, I’m going to make an assumption that you already have caching infrastructure like Redis, Valkey, Momento, etc. If you are, that makes this next part extra easy.
The client libraries from BetterDB tie directly into your existing cache clusters, letting you utilize the infrastructure you already have set up and secured (hopefully). To build our exact-match cache, we use the @betterdb/agent-cache package (betterdb-agent-cache on pip) for three types of values: prompts, tools, and session state.
Let’s take an example of a simple one-shot chatbot that uses Amazon Bedrock to answer customer queries:
import Valkey from 'iovalkey';
import { AgentCache } from '@betterdb/agent-cache';
import { BedrockRuntimeClient, ConverseCommand } from '@aws-sdk/client-bedrock-runtime';

const model = process.env.MODEL_ID;
const bedrock = new BedrockRuntimeClient();
const client = new Valkey({ host: 'localhost', port: 6379 });
const cache = new AgentCache({
  client,
  tierDefaults: {
    llm:     { ttl: 3600 }
  },
});

const handler = async (params) => {
  const messages = [{role: 'user', content: [{ text: params.message }]}];

  const result = await cache.llm.check({ model, messages });
  if(result.hit){
    return result.response;
  } else {
    // Cache miss, call the LLM
    const response = await bedrock.send(new ConverseCommand({
      modelId: model,
      messages
    }));

    const llmResponse = response.output?.message?.content;
    if(llmResponse){
      await cache.llm.store({ model, messages }, llmResponse, {
        tokens: {
          input: response.usage.inputTokens,
          output: response.usage.outputTokens
      }});
    }
    return llmResponse;
  }
}
In the AgentCache initialization, we give it the Valkey client that’s connected to our cluster and configure it with a one hour TTL for prompt caching. Then it follows a basic read-aside pattern: it looks in the cache, if there’s a hit, it returns the cached value. If not, it queries the LLM then saves the value in the cache before returning the response to the user.
You can also see us track the token usage as we store the LLM response. This allows us to track savings directly tied to cache hits.
In a more sophisticated setup with an agent equipped with tools that can lookup data, we add the tool cache capability.
const handler = async (params) => {
  const messages = [{role: 'user', content: [{ text: params.message }]}];

  const result = await cache.llm.check({ model, messages });
  if(result.hit){
    return result.response;
  } else {
    // Cache miss, call the LLM
    const response = await bedrock.send(new ConverseCommand({
      modelId: model,
      messages,
      toolConfig: { tools: tools } // our custom tools for the agent
    }));

    const llmResponse = response.output?.message?.content;
    if(llmResponse){
      await cache.llm.store({ model, messages }, llmResponse, {
        tokens: {
          input: response.usage.inputTokens,
          output: response.usage.outputTokens
      }});

      const toolUseItems = llmResponse.filter(item => 'toolUse' in item && !!item.toolUse );
      if (toolUseItems.length > 0) {
        const toolResults = [];

        for (const toolUseItem of toolUseItems) {
          const { toolUse } = toolUseItem;
          const { name: toolName, input: toolInput, toolUseId } = toolUse;

          let toolResult;
          const cacheResult = await cache.tool.check(toolName, toolInput);
          if (cacheResult.hit) {
            toolResult = JSON.stringify(cacheResult.response);
          } else {
            const tool = tools.find(t => t.spec.name === toolName);
            toolResult = await tool.handler(toolInput);
            await cache.tool.store(toolName, toolInput, toolResult);
          }
          toolResults.push({ toolUseId, content: [{ text: toolResult }] });
        }
      }
    }

    // continue agent loop
  }
}
In this snippet, we added a tool cache check right after we get the response from the LLM. For each tool use in the response, we check if the result for that tool input is already cached. If it is, we use the cached result. If not, we call the actual tool handler to get the result and then store it in the cache for future use.
One thing to call out: we’re caching tool results here, not whole agent turns. A cached LLM response that contains a tool-use request would short-circuit before the tool ever runs, so the clean place to cache in an agent loop is the tool layer, where the same inputs reliably produce the same outputs. I left some of that code out for brevity.
The last type of exact-match caching is session data. It holds the conversation-level context that enriches a thread, anything from a user profile you looked up to an asset a tool generated three turns ago. The API mirrors the other two types, a get and set keyed by thread.
Making your agent even more cache ready
We just went through making our agent more efficient through the use of exact matching. That’s great, but in an environment where humans are involved, exact matching only goes so far. For agents that interact with users, you need another layer on top of what we already built to make it shine: semantic caching.
Let’s take an example. If I ask a chatbot “What’s the weather in Paris today?” and someone else comes along and asks “Is it going to rain in Paris?”, those ultimately result in the same intent: a tool call to a weather API for Paris, France for today’s forecast. But obviously an exact-match cache wouldn’t pick up on that.
Luckily, the @betterdb/semantic-cache package (betterdb-semantic-cache on pip) does this work for us. We don’t need to build embedding functions or add any of that complex logic to our workflow. We just need to pass in the parameters to the package and give a threshold tolerance for what we consider “close enough.” The code is pretty similar to the exact-match approach, but with a couple more config fields:
import Valkey from 'iovalkey';
import { SemanticCache } from '@betterdb/semantic-cache';
import { createBedrockEmbed } from '@betterdb/semantic-cache/embed/bedrock';
import { BedrockRuntimeClient, ConverseCommand } from '@aws-sdk/client-bedrock-runtime';

const model = process.env.MODEL_ID;
const bedrock = new BedrockRuntimeClient();
const client = new Valkey({ host: 'localhost', port: 6379 });
const semantic = new SemanticCache({
  client,
  embedFn: createBedrockEmbed({ client: bedrock }),
  defaultThreshold: 0.15
});

await semantic.initialize();

const handler = async (params) => {
  const result = await semantic.check(params.message);
  if (result.hit) {
    return result.response;
  }

  const messages = [{ role: 'user', content: [{ text: params.message }] }];
  const response = await bedrock.send(new ConverseCommand({ modelId: model, messages }));
  const llmResponse = response.output?.message?.content;

  if (llmResponse) {
    await semantic.store(params.message, llmResponse, {
      model,
      inputTokens: response.usage.inputTokens,
      outputTokens: response.usage.outputTokens,
    });
  }
  return llmResponse;
}
The big thing to notice in this code is the defaultThreshold parameter in the semantic cache constructor. That value is the cosine distance (as opposed to the cosine similarity we often see with vector search). The lower the number, the more similar the values are. 0 is an identical phrasing. The higher you set it, the more aggressively it treats different wordings as the same question. The default of 0.1 keeps close paraphrases honest. Bumping it to 0.15, like above, is the range I find best for conversational use. Set it too high and you’ll start serving the Paris forecast to someone asking about London.
NOTE: This package has stricter requirements than agent-cache. It requires Valkey 8+ with the valkey-search module (available on ElastiCache for Valkey and Memorystore for Valkey). The exact-match tiers run anywhere, but this one has some constraints.
What this looks like in real life
As much as I love theory, seeing it in practice is infinitely better. BetterDB has a RAG chatbot at chat.betterdb.com built with these packages that answers questions about Valkey, Redis, Dragonfly, and its own docs. There’s a metrics panel next to the chat window that shows what the cache is doing, both all-time and for your own session, updating per turn as you ask things.
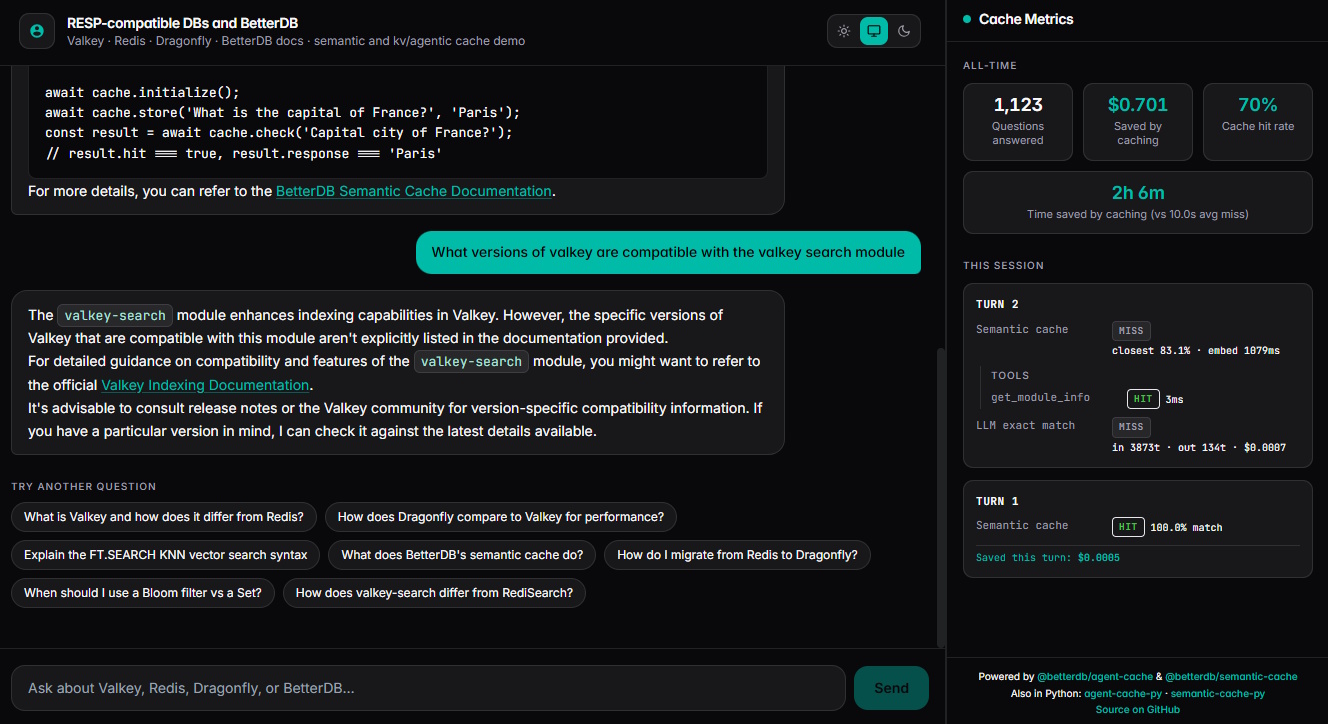
It’s worth a look. You can feel the difference in experience on a cache hit vs a miss. That alone should be incentive for you to build this way. The “saved by caching” money counter is icing on the cake. Turning our code samples above into dollar signs is a real-world eye opener for me. So go ahead and ask it something, then ask the same thing a different way, and watch the second one come back as a semantic hit. It’s pretty neat.
That said, I’d be doing you a disservice if I let that 70% cache hit rate sit there without a word of warning. A docs bot is caching on easy mode. The topic is narrow, the app gives suggested questions, and people paraphrase the same dozen things endlessly. Your workload will hit a lower number. That’s expected and totally fine. The important part is the mechanism driving it.
But it gets better.
The self-tuning loop
A cache layer with a fixed TTL will drift over time. The shape of traffic changes. The tool mix changes. A new feature shifts the questions users ask. The TTL you originally picked at launch might be different 30 days in if you had the data to make that call.
Both packages give you that data. Each exposes a method that reads its own performance and hands back a recommendation. On the agent cache it’s toolEffectiveness(), a hit rate and a recommendation per tool:
const effectiveness = await cache.toolEffectiveness();
// [
//   { tool: 'get_module_info', hitRate: 0.5,  recommendation: 'optimal' },
//   { tool: 'search_docs',     hitRate: 0.05, recommendation: 'decrease_ttl_or_disable' },
// ]
It tells you to bump the TTL when a tool hits above 80% and could cache longer, leave it alone when it’s healthy, and drop/disable it when it’s not earning its keep.
With the semantic cache package, it’s thresholdEffectiveness(), which reads the rolling distribution of similarity scores and tells you whether your threshold matches your actual traffic:
const result = await cache.thresholdEffectiveness();
// {
//   recommendation: 'loosen_threshold',
//   recommendedThreshold: 0.15,
//   reasoning: 'High near-miss rate with small deltas - many queries
//               falling just outside the threshold.',
//   hitRate: 0.61,
// }
This is the cooler and more useful one. The threshold is the hardest config option to set by intuition, and this turns “I guessed 0.15, is that right?” into a real answer from your data. If you have too many queries landing just outside the threshold, it tells you to loosen it and by how much. Too many borderline hits sneaking through, it tells you to tighten.
What you do with the recommendation is up to you. Log it, post it in Slack, or automate it straight into your config and let the cache retune itself. With access to this kind of usability data, closing the loop is a few lines of code.
If you’d rather not build the loop yourself, BetterDB Monitor runs it for you against these same methods. You could also read about how Kristiyan automated everything with a cron job and some elbow grease.
Is it worth it?
Agent workloads repeat themselves way more than anyone gives them credit for. They repeat themselves in exact match scenarios where the machine asks the same thing byte for byte, and semantically when a human asks it something three different ways. Miss either and you’ll end up with unnecessary latency and charges on your monthly bill.
Luckily, it costs so little to set it up. If you already run a cache, you already have the hard part. Two packages and a cache pattern you’re probably already doing, and things get a little less expensive. Then the effectiveness methods turn everything into a feedback loop, and the config you guessed at on day one is replaced with the one that addresses your usage patterns on day thirty.
That 70% on the demo is the easy case, and your number will be lower. But it doesn’t matter. The pattern is the important part. Whatever your traffic repeats in real life, this helps catch it, and you stop paying twice (or three or four or a hundred times) for the same answer.
A word to the wise: when a cache looks like it’s working “too well,” it probably is. Hit rates look great, the latency graph looks great, and the agent serves slightly stale answers because the docs changed upstream and nothing noticed. They say the two hardest things in computer science are cache invalidation and naming things. This isn’t a miracle pattern. You still have to build your invalidation logic. The self-tuning loop helps some, but you still need to watch for changes in the source, not just in the configuration thresholds. Something to build another day.
Until then, happy coding!


Join the Ready, Set, Cloud Picks of the Week
Thank you for subscribing! Check your inbox to confirm.
View past issues. | Read the latest posts.