
Ai
 Share on:
Observability for MCP servers with Kestra
The internet is buzzing with chatter on AI right now, myself included. Specifically what has caught my eye and attention is the model context protocol (MCP). MCP is a standard that allows large language models (LLMs) to work with tools (code) to perform tasks.
And as with any viral adoption of an emerging standard, there’s lots of production-grade aspects to it that simply aren’t getting implemented. Security, author verification, and observability are three major components to any piece of software that aren’t getting the answers they deserve (even though they’re getting plenty of attention).
I recently published a blog on the lack of MCP security and one potential solution, so today I want to focus on something else that everybody wants but has limited insights into: observability.
Specifically, I want to talk about observability with MCP tool usage. There are already some great offerings for observability of AI Agents and some standards emerging for OTel with agents, but I haven’t seen much around analyzing which tools are being used, how fast they’re operating, and if they’re being used successfully or not. So I decided to build a proof of concept using Kestra to asynchronously collect and aggregate my usage data.
Note - This article is sponsored by Kestra. The endorsement is for my attention, not my opinion. This article is a reflection on my personal thoughts towards the product and not that of Kestra. Ok, now that we have that out of the way, let’s check out some cool stuff!
Before we dive into the solution, let’s level-set to make sure we know exactly where we’re observing usage.
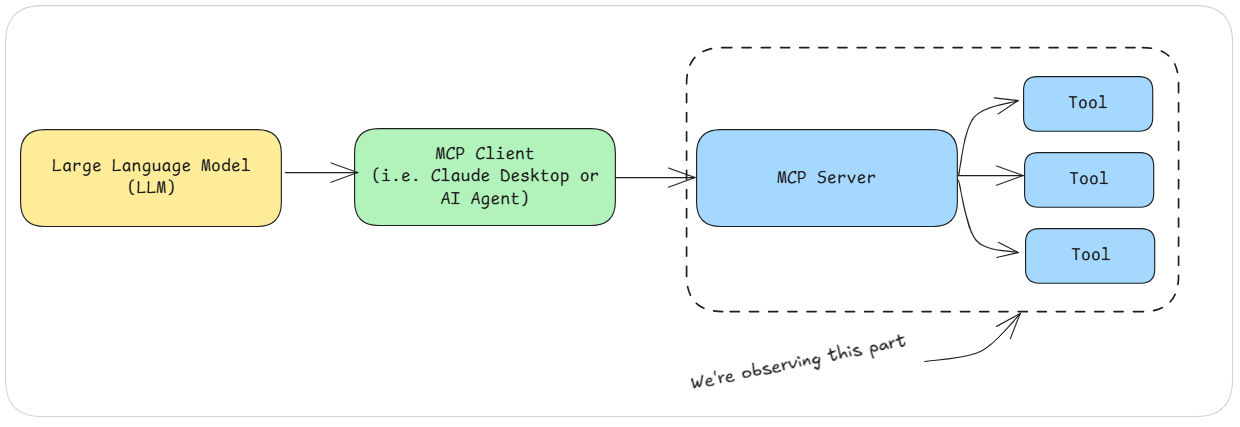
What we’re building
As far as the build goes, we need to create three things:
- MCP Server with multiple tools
- Async workflow to collect, aggregate, and analyze data
- UI to visualize analytics
You guys have heard me say it before, I’m lazy. If there’s something out there that can manage and do stuff for me so I don’t have to, I’m going to do it. So we’re going to lean on some cloud-based tools that do amazing work that gets you from idea to done in no time. For orchestration, we’re going to use Kestra. Data storage will be handled by Momento. The user interface will be handled by Postman, believe it or not (more on this later).
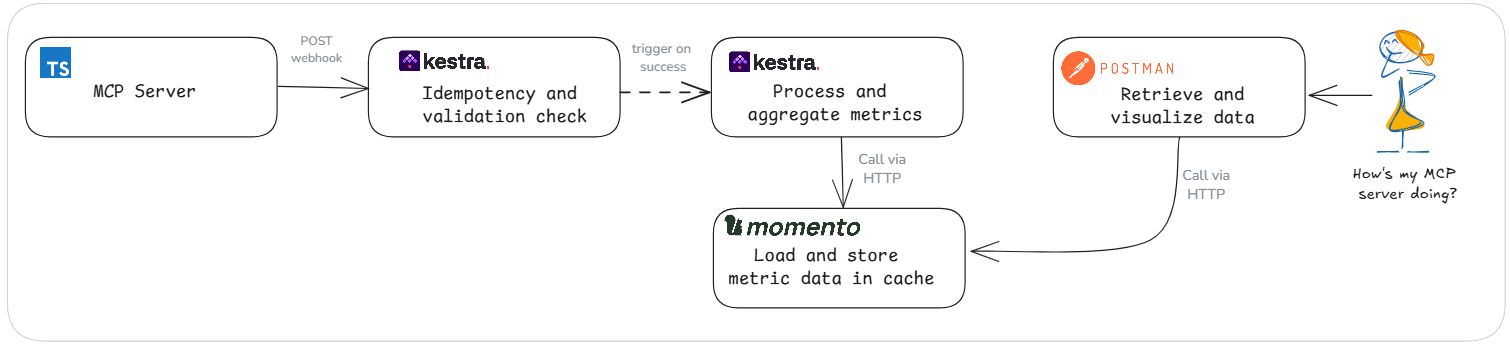
Observability should never slow you down. We’re wrapping all the tools in our MCP server with a withTelemetry function call that tracks the latency, success, and which tool is invoked. This wrapper sends telemetry data to Kestra asynchronously via a quick HTTP POST with a webhook trigger, letting the tool do its job while the metrics flow in the background.
The MCP server
My MCP server is a garden helper. I have a 1/4 acre garden with dozens of beds and hundreds of plants. This server allows me to talk with Claude and have all my notes, harvests, and garden layout tracked automatically.
We won’t stay on this part for too long. For better or for worse (in my opinion, for worse), MCP servers are a dime a dozen. Everybody’s got one, and there are literally hundreds of examples out there. That said, I’ll show you an abbreviated portion that implements our withTelemetry hook.
server.setRequestHandler(CallToolRequestSchema, async (request, extra) => {
  const { name, arguments: args } = request.params;
  let toolFn;
  switch (name) {
    case 'add-bed':
      toolFn = insertGardenBed;
      break;
    case 'list-beds':
      toolFn = listGardenBeds;
      break;
    case 'list-all-observations':
      toolFn = getAllObservations;
      break;
    // remainder of tools defined here
  }

  const result = await withTelemetry(name, args, toolFn);
  return { content: [{ type: 'text', text: JSON.stringify(result) }] };
});
This setup centralizes all the tool definitions and uses a switch statement to determine which method to call. This allows us to easily wrap the code for the tools in a single place so we can implement the telemetry logic a single time.
async function withTelemetry<T, R>(toolName: string, params: T, fn: (params: T) => Promise<R> | R): Promise<R> {
  const start = Date.now();
  let result: R;
  let success = true;
  let error: any;
  try {
    result = await fn(params);
    return result;
  } catch (e) {
    success = false;
    error = e;
    throw e;
  } finally {
    const telemetryEvent = {
      timestamp: new Date().toISOString(),
      tool_name: toolName,
      params,
      success,
      latency_ms: Date.now() - start,
      invocation_id: uuidv4()
    };

    await fetch(KESTRA_ENDPOINT, {
      method: 'POST',
      headers: {
        'Content-Type': 'application/json',
        'idempotency-key': uuidv4()
      },
      body: JSON.stringify(telemetryEvent)
    });
  }
}
To avoid processing metric data multiple times accidentally, we provide an Idempotency header that will be processed by Kestra before running the main processing logic.
Note - You can find the full source code on GitHub.
Async workflow processing with Kestra
Now let’s talk about where the magic happens. Kestra is a powerful workflow engine that has hundreds of plugins allowing you to connect to virtually anything. Supporting both orchestration and choreography, Kestra allows you to build multi-step branching workflows through a declarative YAML approach. Being an AWS SAM user for years, this felt like a solid approach to defining complex workflows because of my familiarity with declarative coding/configuration. I like the declarative approach because I feel like it provides more visibility into what’s happening, reducing cognitive load.
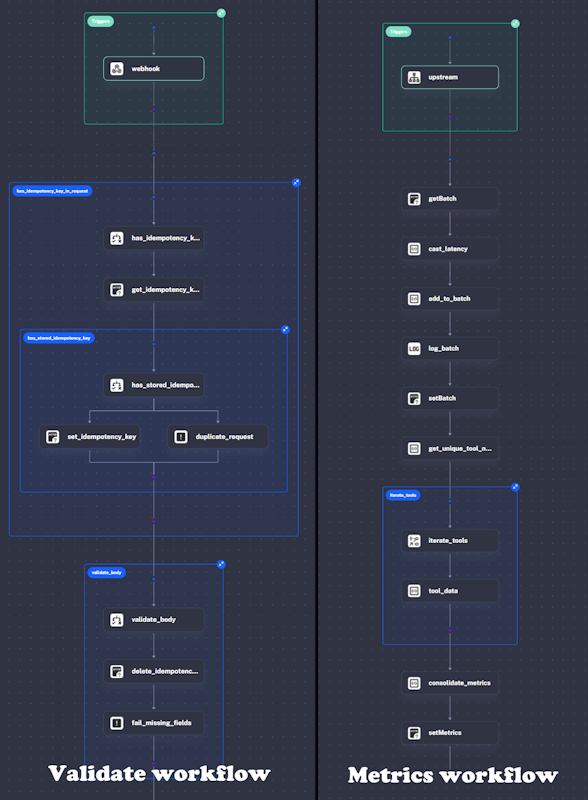
I built two workflows for our metric aggregation. One to handle our idempotency check and validate incoming data, and another to run the business logic. You can see both workflows rendered visually through the Kestra UI.
When the validate workflow completes successfully, a Flow trigger is executed that will automatically start our metrics workflow. It passes in the validated inputs so the workflow can run assuming everything is unique and correct. This workflow is triggered asynchronously, so nothing is waiting on it to complete.
My goal with these workflows was to not write any code, similar to how I build my Step Function workflows in AWS. If I can get by writing only “configuration”, I prefer to do that—it ultimately ends up being easier to maintain over time.
Both of these workflows use Momento Cache as a temporary data store. Usage analytics are temporary, and I built this to view data over a 5 minute window. Using Momento means I can set this data and have it automatically be cleaned up after my 5-minute window, not to mention have it run blazingly fast.
Idempotency and validation
This workflow has a simple purpose - make sure we aren’t processing data we’ve seen before and make sure all the data is there that’s supposed to be. To validate we haven’t seen the data before, all we’re doing is checking the cache for a key that matches the idempotency header. If a key exists that matches the idempotency header, we fail the execution and are done.
Since this code is running async, meaning the caller isn’t waiting on us to complete the execution, I decided to skip payload verification. In a standard idempotency validation setup, you’d hash the payload associated with the key. If the incoming hash doesn’t match the stored hash, you would return an error. If it does match, you would simply return the result from the first time we saw that idempotency key. But in this scenario, there’s nobody to return an error or result to, so we abort execution.
If we haven’t seen the idempotency key before, we do a quick check to make sure all the expected inputs were provided and continue. With Kestra, that logic check is a simple declarative step:
- id: validate_body
  type: io.kestra.plugin.core.flow.If
  condition: "{{ trigger.body.timestamp is not defined or trigger.body.tool_name is not defined or trigger.body.success is not defined or trigger.body.latency_ms is not defined }}"
  then:
    - id: delete_idempotency_key
      type: io.kestra.plugin.core.http.Request
      uri: https://api.cache.cell-us-east-1-1.prod.a.momentohq.com/cache/chat?key={{trigger.headers['x-idempotency-key'] | first}}
      method: DELETE
      options:
        allowFailed: true
      headers:
        Authorization: "{{kv('MOMENTO')}}"
    - id: fail_missing_fields
      type: io.kestra.plugin.core.execution.Fail
      errorMessage: "Missing one or more required fields in the request body"
Shown here is us validating the fields and if they don’t exist, deleting the idempotency key so the caller could retry (if necessary) and marking the execution as failed. If the expression evalues to false we fall through and the execution is successful, which kicks off the metrics workflow.
Metric analytics
For metric analytics, we’re going to be processing batches of data. We store an array of raw metrics in our cache, appending the incoming metric data to it with every execution. To do that, we call the Momento HTTP API to first get the batch, then use a combination of Pebble (a popular templating engine Kestra uses to dynamically render variables) and jq to manipulate the data without writing a script. The combination of Pebble and jq is pretty powerful after you get the hang of it (it took me a few laps on the struggle bus 😅).
- id: getBatch
  type: io.kestra.plugin.core.http.Request
  uri: https://api.cache.cell-us-east-1-1.prod.a.momentohq.com/cache/chat?key=rawMetrics
  method: GET
  options:
    allowFailed: true
  headers:
    Authorization: "{{kv('MOMENTO')}}"
- id: add_to_batch
  type: io.kestra.plugin.core.debug.Return
  format: >
    {% set success_str = inputs.success %}
    {% set is_success = success_str == 'true' or success_str == 'True' or success_str == '1' %}
    {% set latency = outputs.cast_latency.value | jq('.latency_ms') | first %}
    {% set entry = {
      "timestamp": inputs.timestamp,
      "tool_name": inputs.tool_name,
      "success": is_success,
      "latency_ms": latency
    } | toJson %}

    {% if outputs.getBatch.code == 200 %}
      {{
      outputs.getBatch.body | jq('. += [' ~ entry ~ ']') | first
    }}
    {% else %}
      {{ '[ ' ~ entry ~ ' ]' }}
    {% endif %}
In our example above, you can see how we’re accessing our Momento API key using the key value store in Kestra. This allows us to store data outside of our workflow definition and look it up dynamically. We don’t want to be storing strings as plaintext in our definition files, after all!
What you also see is an inline if statement using Pebble. We’re saying “if there’s already a batch in the cache, append the data to it, otherwise create a new array with just the incoming data.” After we do this, we save the updated/new array back into Momento. Simple enough!
Disclaimer - processing data like this is not safe at high scale, you will certainly run into situations where you’ll overwrite data due to concurrent processing. In those situations you must either implement a locking mechanism like a semaphore or use an atomic collection, like a Momento list that allows for thread-safe manipulation of arrays.
After we save the incoming metrics to our existing batch, we need to run analytics. For the best observability, I want to see data broken down by tool. How many times was it called? How many were successful? What were the average, p99, and max latencies? To do this, we can grab all the unique tool names using jq and iterate over all the corresponding metrics using a Kestra ForEach task. Then we use jq again to do some math and build our consolidated json output.
- id: get_unique_tool_names
  type: io.kestra.plugin.core.debug.Return
  format: >
    {{ outputs.add_to_batch.value | jq('[.[].tool_name] | unique') | first }}
- id: iterate_tools
  type: io.kestra.plugin.core.flow.ForEach
  values: "{{ outputs.get_unique_tool_names.value }}"
  tasks:
    - id: tool_data
      type: io.kestra.plugin.core.debug.Return
      format: >
        {% set tool = taskrun.value %}
        {% set filtered = outputs.add_to_batch.value | jq('map(select(.tool_name == "' ~ tool ~ '"))') | first %}
        {% set total = filtered | jq('length') | first %}
        {% set successful = filtered | jq('[.[] | select(.success)] | length') | first %}
        {% set avg_latency = filtered | jq('[.[] | .latency_ms] | add / length') | first %}
        {% set max_latency = filtered | jq('[.[] | .latency_ms] | max') | first %}
        {% set p99_latency = filtered | jq('[.[] | .latency_ms] | sort | .[(length * 0.99 | floor)]') | first %}
        {
          "tool_name": "{{ tool }}",
          "total": {{ filtered | jq('length') | first }},
          "percent_successful": {{ (successful * 100.0 / total) }},
          "success_count": {{ successful }},
          "latency": {
            "average": {{ avg_latency}},
            "max": {{ max_latency }},
            "p99": {{ p99_latency }}
          }
        }
- id: consolidate_metrics
  type: io.kestra.plugin.core.debug.Return
  format: >
    {{ outputs.tool_data | jq('.[].value ') }}
After this code runs, we have a json array of analytics for each MCP server tool that has been executed in the last 5 minutes. We save this back to Momento under a metrics key and we’re golden!
Viewing the data with Postman
I’m a career backend engineer. I’ll reluctantly build user interfaces if I have to, but it’s likely going to be vibe coded and look like a backend engineer made it 😂. If I don’t have to build a whole thing, I won’t.
All we really want to do is render the json we just built in a way so I can see what’s happening at a glance. Luckily, the Postman visualizer can do exactly this. Whenever you execute a request in Postman, you can tell it to take the json from the response and render it in html using Handlebars.
Now, I’ve used Handlebars for a long time with my newsletter automation, but I wouldn’t consider myself an expert in it. I also wouldn’t consider myself an expert in what is the most meaningful way to display metrics on screen. And I don’t have to be.
This was probably the fastest part of my entire project. I create a new request in Postman and pointed it at the Momento HTTP API to pull the metric data we just created. Then I opened up Postbot and told it to “Visualize the metrics from this response using charts that show me meaningfully the overall health of my application.”
3 seconds later I’m looking at a bar chart showing me latencies broken down by tool and a beautiful table showing me all the usage data of my MCP server. The best part? I didn’t touch a single CSS class 🙌
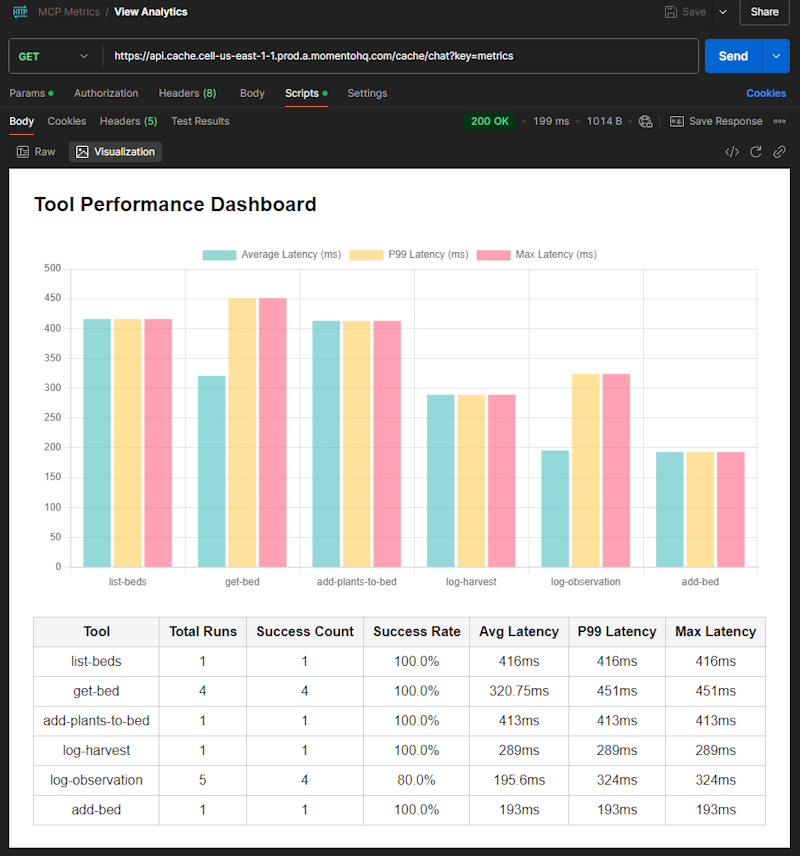
I can’t get over how easy it is to take my raw data and turn it into something meaningful. I can execute this request as often as I like and get a graphical representation of exactly what is going on with my MCP server—something that’s been missing from every implementation I’ve seen so far!
Final thoughts
While this felt like a lot of moving parts, to a user it should just feel like magic. Everything is happening transparently to the human interacting with the AI agent or MCP client. The client calls the tool, the tool does work and emits a signal with some data, Kestra processes the data and saves it into Momento, then Postman pulls it out of Momento on demand and displays it with nice visual charts.
The magic here is that nearly everything was config. No scripts. No pipelines. Just YAML, HTTP, and tools that do their job. Besides the business logic in the MCP server we wrote, there’s technically no code anywhere. It’s all just configuration in the form of YAML in Kestra and a request in Postman. Kestra took care of wiring up all the tasks together and exposing the endpoint for our webhook to call, and Postbot took care of analyzing the data we’re recording and figuring out how to display it meaningfully.
Kestra took me a while to get used to. I had anchored opinions from my years of practice with AWS Step Functions, but once I was able to step back a bit from that, things started jiving. My project didn’t even scratch the surface of what Kestra can do. But we did see some critically important capabilities:
- Expose endpoints for webhook triggers
- Choreograph workflows with flow triggers
- Transform data without writing code
- Securely store and access your secrets
- Visualize complex workflows graphically
- Natively call and process external HTTP endpoints
Overall, I think Kestra is a powerful workflow builder bringing a ton of connectivity to the table. Once you learn the nuance of how to transform and structure data, it can become a huge asset in your development arsenal.
On a different note, we have analytics in our MCP server! That’s the icing on the cake for me. This was a fun project that let me practice some computer science skills without falling back on my AWS security blanket. There are lots of amazing tools out there providing out-of-the-box capabilities that drastically speed up development, and I’m thrilled I got a chance to use them to build something practical.
Do you have ideas on how to make this better? Fork it on GitHub or send me a message and let’s get to work!
Happy coding!
Related posts

Join the Ready, Set, Cloud Picks of the Week
Thank you for subscribing! Check your inbox to confirm.
View past issues. | Read the latest posts.