
Application development
 Share on:
How to Automatically Monitor API Performance with Dynamic Testing
If I asked you, “what are the key indicators of a strong API”, what would you say?
Would you mention reliability? Documentation? Security? Developer experience?
You might be surprised to hear that most people don’t mention performance. How fast does the API run? Whether or not they know it, they subconsciously think it.
If you use a new API for the first time and it takes 5 seconds to respond, you’re probably going to get a bad impression. It’s 2020, that response should have been sub second. It should have just worked.
Whether we know it or not, we judge performance just as high (if not higher) than any other metric. It’s what drives our user experience. We don’t want users waiting for an action to happen. It should be automatic.
So what do we do?
Establish Acceptable Parameters
First thing’s first - you need to answer the question “what is performant”? What are the guidelines your API needs to hit for you to consider the speed acceptable? With performance testing, the two most common metrics we monitor are:
- Average execution time - How fast the API responds on average across all executions
- P99/Max execution time - How fast are the slowest executions
P99 means 99%. Ninety-nine percent of your requests must be under a specific time. It’s ok for 1% of your calls to be slower than the threshold. Anomalies happen, it’s just a fact of life. So measuring in terms of the 99% will yield consistent results and factor out the anomalies.
When coming up with your parameters, remember that you are defining acceptable parameters, not your ideal parameters. Ideally, your API would respond in 1 millisecond, but realistically it is acceptable to respond in 500ms on average.
End users will typically notice if they are waiting for longer than 1 second. If they are waiting for longer than 5 seconds they tend to leave your site entirely. So strive to keep that p99 around 1000-1200ms.
 Photo by Dane Deaner on Unsplash
Setup The Performance Tests
With acceptable performance parameters in place, it’s time to actually test the performance of your API.
All a performance test does is hit your API and record the response times, so that should be something easily automatable, right? Right!
With a tool like Postman, you have the ability to define your API structure natively in the application and run automated tests both on demand and on a regular schedule.
I have created a Postman collection and environment on GitHub that will take your API definition, turn it into a series of performance tests, hit your API a configurable number of times, and return the average and slowest execution times per endpoint.
Best part? You don’t have to do anything! Well, you have to import the source from GitHub and configure a couple of environment variables, but that’s it!
Environment Variables
Before you run the performance test collection, you must set a few environment variables:
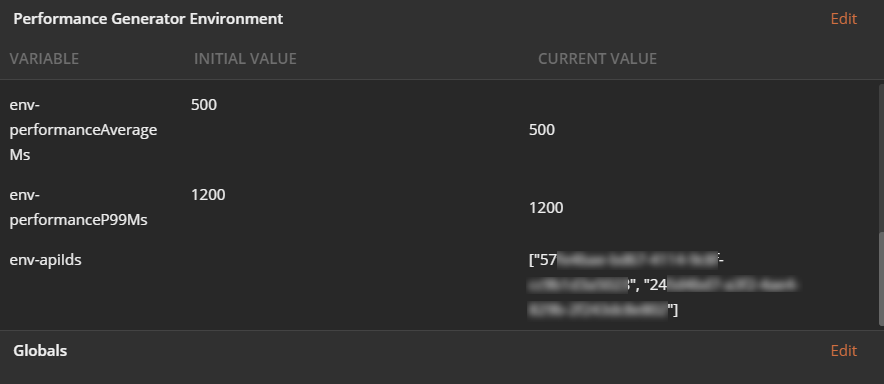
env-apiKey- Integration API Key for Postman (string) - Postman documentation on API keysenv-server- Name of the environment you want to run. This value matches thedescriptionproperty in theServersobject of your API definition (string)env-performanceIterations- How many times each API endpoint in your definition document should be executed (integer)env-performanceAverageMs- The non-inclusive threshold in milliseconds for how fast the average response time should be of each endpoint (integer)env-performanceP99Ms- The non-inclusive threshold in milliseconds for how fast the slowest execution allowed is per endpoint (integer)Either
env-apiIdsorenv-workspaceIdshould be defined.- If
env-apiIdsis defined, the generator will test all Postman APIs with the provided ids (array of strings) - If
env-workspaceIdis defined, the generator will test all APIs in the Postman workspace provided (string)
- If
Locating Variable Values
Finding some of the values to put in the environment can be tricky.
env-server- In your Open API Specification, you should have a section defined calledservers. This property defines the base url for all the environments where your API lives. In order for the performance test generator to know which base url to use, you must define it in the postman environment. Theserverobject is defined byurlanddescriptionproperties. To tell the generator which server to use, simply add the description into the environment variable.

env-workspaceId- In Postman, all resources are associated with a workspace for proper organization. In the performance test generator, you have the option to dynamically load all the APIs in a provided workspace so it will automatically start testing any new APIs you create. To find the workspace id, you must log into the Postman web app, click on the workspace you want to test, then locate the id in the url.
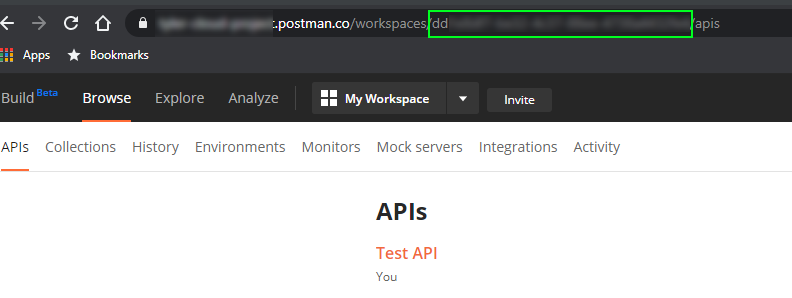
env-apiIds- If you would rather explicitly define which APIs to test, you have the ability to do that as well. Using the same method as above for finding the workspace id, you will navigate to the APIs you which to test in the Postman web app, grab the id from the url, and use it in the environment variable. If you only want to test one API, you can simply put the id into the variable. However, if you want to test more than one API, you have to make it an array by surrounding the ids with square brackets[ ]and double quotes" ".
API Definition
The most critical part of the generator is your API definition file. It requires your definition document to be written with the Open API Specification v3 format in either json or yaml.
I have written a few times on the specification, and highly recommend getting familiar with how it is structured. It is quickly becoming an industry standard for defining APIs.
For the generator to work properly with your API definition, all endpoints in your API must have the schema of the request body defined (if applicable). The schema must include an example value for every property. This is what the generator uses to feed into your API.
It might seem a little tedious filling out example values for everything, but on the bright side - you get free dynamic API performance tests (and even contract tests and security tests!) plus some highly descriptive API documentation that is generated for you from Postman itself. Win-win!
For a full, working example of an API definition, check out my Gopher Holes Unlimited API.
Running The Tests
Once you have the environment variables configured and your Open API Specification properly defined, it’s time to give this puppy a whirl! First, we will run it manually.
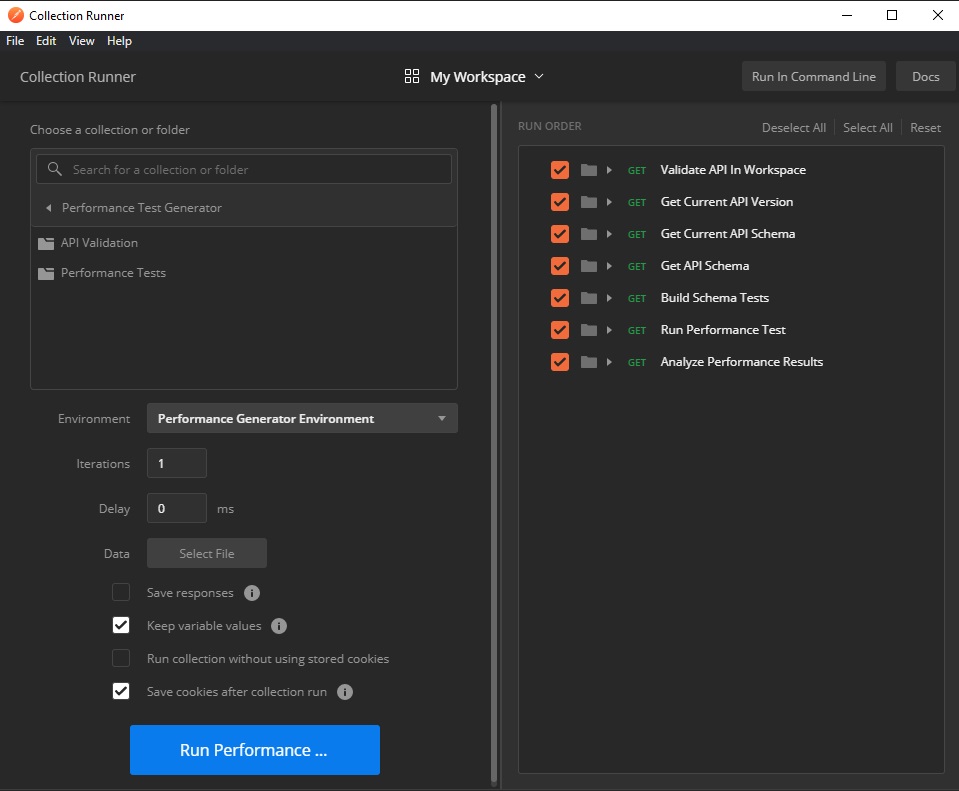
- From within Postman, click on the Runner button
- Select the Performance Test Generator collection
- Select Performance Generator Environment in the environment picker
- Hit Run Performance … button to begin execution
This will kick off the generator and it will begin building tests and hitting your API.
If you wish to perform this task automatically, you have the ability to set up a monitor so your tests can run on a schedule. To do this, you can perform the following tasks.
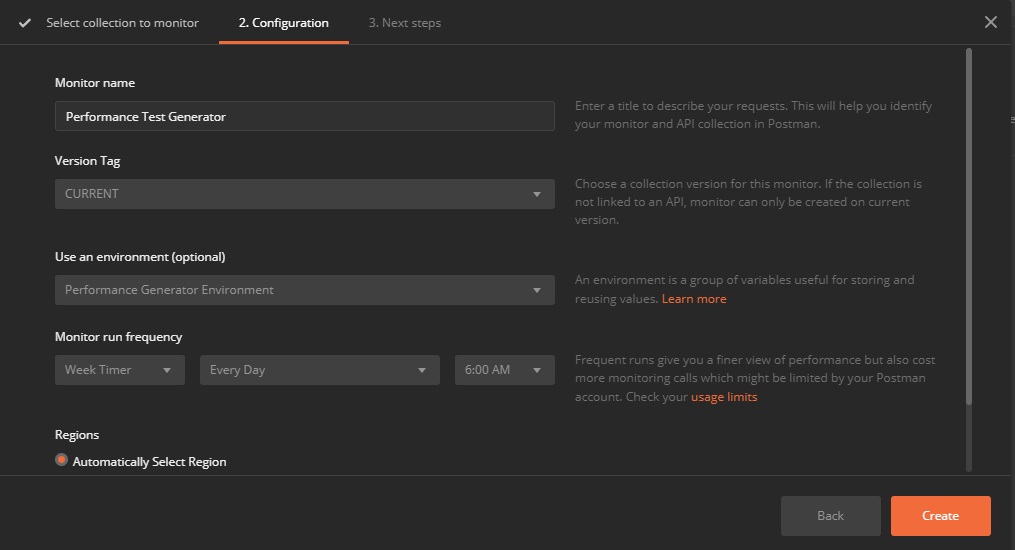
- Right click on the Performance Test Generator collection in your workspace and select Monitor Collection
- Select the Performance Generator Environment in the Use an environment (optional) picker
- Select the frequency you’d like the collection to run
- Hit Create to create your monitor
Now you have a scheduled time your performance tests will run! Best of all, since this dynamically loads your API definition and builds tests from it, you don’t ever have to maintain it! It updates as you build out your definition.
Test Results
After the generator runs, it will perform some analysis on the results:
- Was the average response time less than the configured average in the environment?
- Was the slowest response time less than the configured p99 in the environment?
- Were at least half the responses a success (2XX status code)?
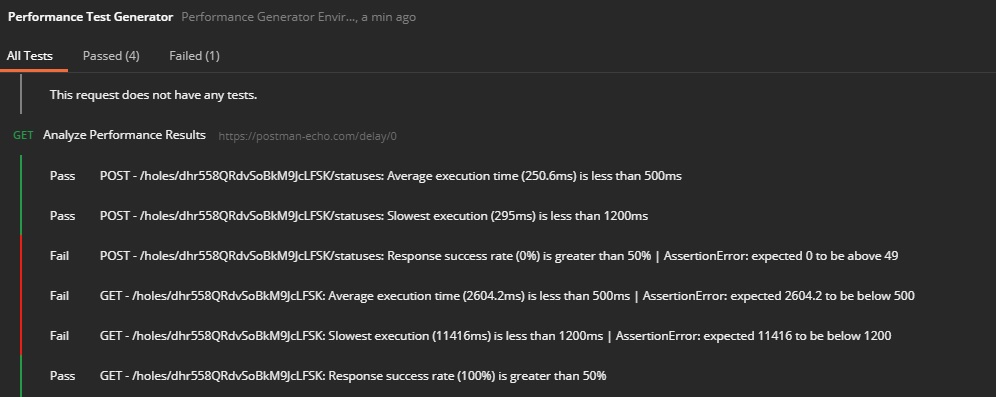
As you can see, my Gopher Holes Unlimited API needs a little bit of work. I have one endpoint that is failing 100% of the time and another that is way too slow.
Do with this what you like. At this point, failures are up to the implementation of the API. If they are slower than your threshold, see what you can do to speed up that API.
If more than half of your responses are failures, you either have a bug in your API or your example values are wrong in your definition document. Either way, fixing those issues will make your API stronger than it was before.
Conclusion
Remember that a fast API gives a strong impression of reliability. A strong impression of reliability will keep your consumers happy and drive business.
These performance tests are a low cost, high value component to add to your API development process. Since you no longer have to spend time creating and maintaining heavy performance tests, you can spend your time on higher value things - like solving business problems or investing in new features.
Whatever you do, I hope you enjoy the generator. It was designed with the intention of saving time and promoting best practices in your API designs. If you have any questions, feel free to reach out to me on Twitter and we can connect.


Join the Ready, Set, Cloud Picks of the Week
Thank you for subscribing! Check your inbox to confirm.
View past issues. | Read the latest posts.